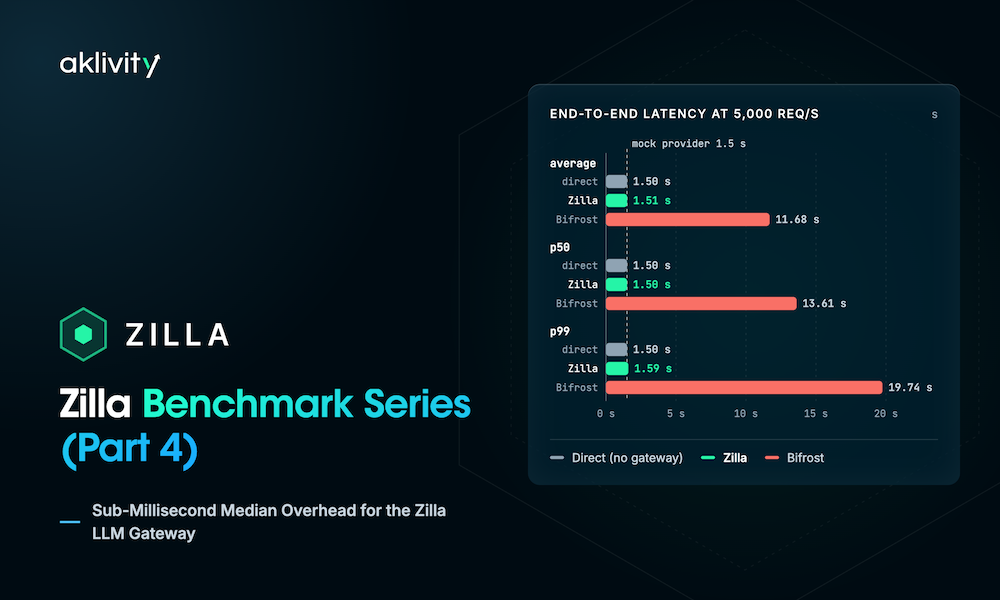
Sub-Millisecond Median Overhead for the Zilla LLM Gateway: Aklivity Zilla Benchmark Series (Part 4)
At 5,000 req/s, Zilla answered every request and spent 0.21 ms on the median request, with model routing taking 20 µs.



Introduction
Part 1, Part 2, and Part 3 of this series measured Aklivity Zilla in front of Apache Kafka.
This post measures Zilla as an LLM gateway. Clients send OpenAI-compatible chat completion requests to Zilla, and Zilla routes them by model to an upstream provider.
We ran a 5,000 requests per second scenario with the load generator and mock provider from an open-source LLM gateway benchmarking repository.
The Short Version
- Zilla answered every request at 5,000 req/s. On a c7i.xlarge, all 150,000 measured requests returned 200, with a p50 of 1,502 ms and a p99 of 1,591 ms against a mock provider that takes 1,500 ms.
- Against a direct baseline, Zilla added 0.9 ms at p50 and 89 ms at p99. Sent straight to the mock provider over the same protocol, the same load measured 1,500.9 ms at p50 and 1,502.5 ms at p99.
- Zilla's own share of a request is under a millisecond at the median. Traced from the engine directory, the median request spent 0.21 ms inside Zilla, across every stage of the request and response paths.
- Zilla's model routing took 20 µs for the median request. That figure excludes JSON parsing and encoding, HTTP/2 handling, and network writes.
- With streamed responses, Zilla held its latency where Bifrost's grew. At 2,000 req/s over HTTP/1.1, across OpenAI and Anthropic clients and providers, Zilla's stream p99 was 1.6 to 2.1 s against Bifrost's 2.0 to 9.3 s. With JSON responses, both gateways stayed within 100 ms of the mock provider at p99.
How We Benchmark
- A mock provider, not a real model. The mock answers every request after a fixed 1,500 ms, so any latency above 1,500 ms comes from the gateway, the network, or the load generator.
- Separate hosts. The gateway, the load generator, and the mock provider each run on their own instance, so they do not compete for CPU.
- Open-loop load. The load generator sends at a fixed rate whether or not earlier requests have completed, so a slow gateway shows up as rising latency.
- A direct baseline. The same load, sent from the load generator straight to the mock provider with no gateway, shows the latency the test setup itself adds.
Benchmark Setup
All runs used the Aklivity fork of maximhq/bifrost-benchmarking. The fork adds the Zilla Gateway and HTTP/2 cleartext support to the load generator and mock provider.
Topology
Each run used three instances of the same type in one AWS availability zone, connected over private IPs:
- Gateway: Aklivity Zilla
- Load generator: benchmark.go from the Aklivity fork of maximhq/bifrost-benchmarking.
- Mock provider: the mocker from the Aklivity fork of maximhq/bifrost-benchmarking.
For the direct baseline, the gateway instance stays idle and the load generator sends to the mock provider over the same protocol and connections.
Workload
Zilla LLM Gateway
The full configuration is zilla/zilla.yaml in the benchmarking repository.
The LLM gateway itself is three bindings: one accepts OpenAI requests, one routes them by model, and one sends them to the OpenAI-compatible provider:
Routing another model to a different provider adds one route and one client binding.
Zilla at 5,000 Requests per Second
Both runs used c7i.xlarge instances, HTTP/2 cleartext, and 0.36 KB responses, with the load generator on four connections.
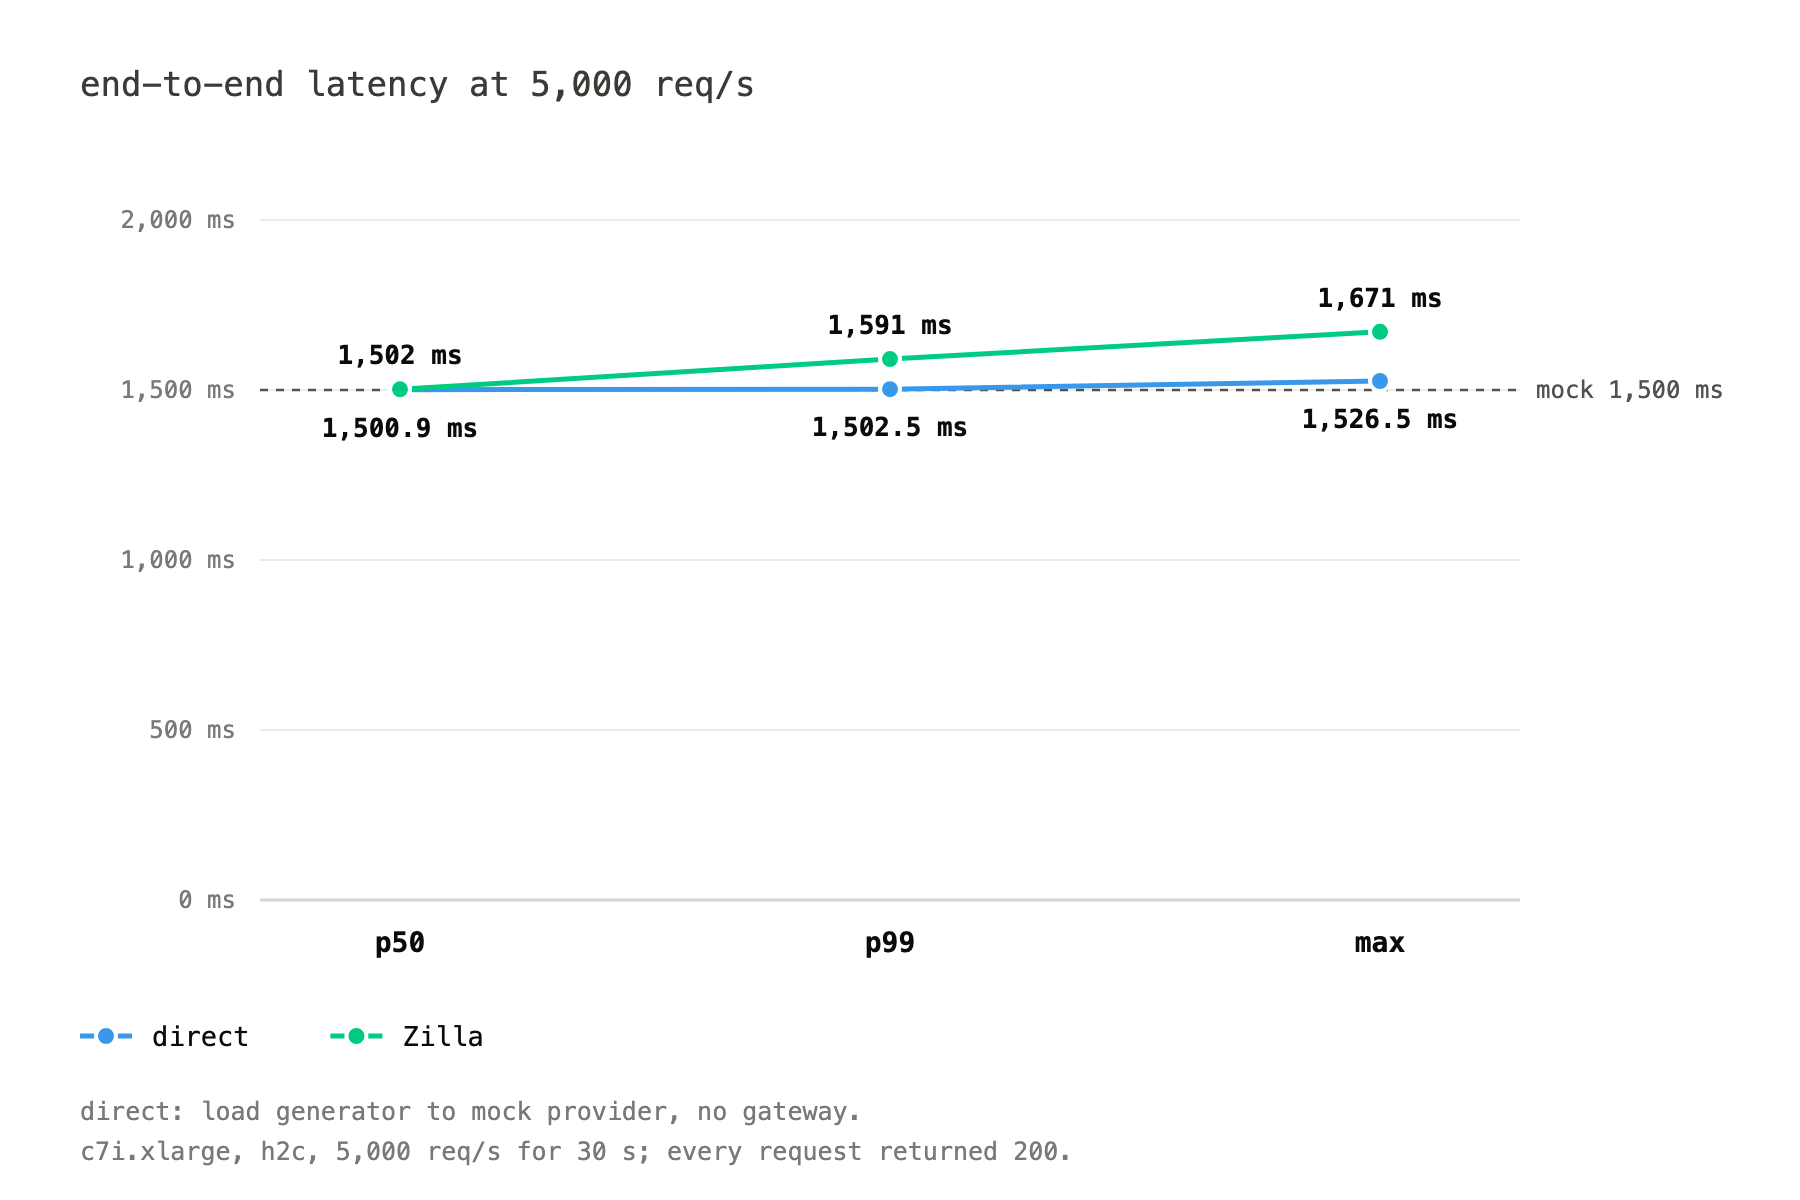
The chart shows p50, p99, and max end-to-end latency, including the mock provider's 1,500 ms.
Without a gateway, the load generator, mock provider, and network added 0.9 ms at p50 and 2.5 ms at p99 above the mock provider's 1,500 ms. Through Zilla, the same load measured 0.9 ms at p50 and 89 ms at p99 above it.
That end-to-end difference includes an extra network hop and both of Zilla's connections. The breakdown below measures the time inside Zilla directly.
Detailed Performance Breakdown for Zilla
A Zilla configuration is a chain of bindings, each handling one stage of the request, such as HTTP, OpenAI parsing, or routing. Zilla records every message that passes between bindings in its engine directory: memory-mapped ring buffers, one per engine worker.
One Request, Step by Step
The median request spent 0.21 ms inside Zilla: 128 µs on the request path and 77 µs on the response path.
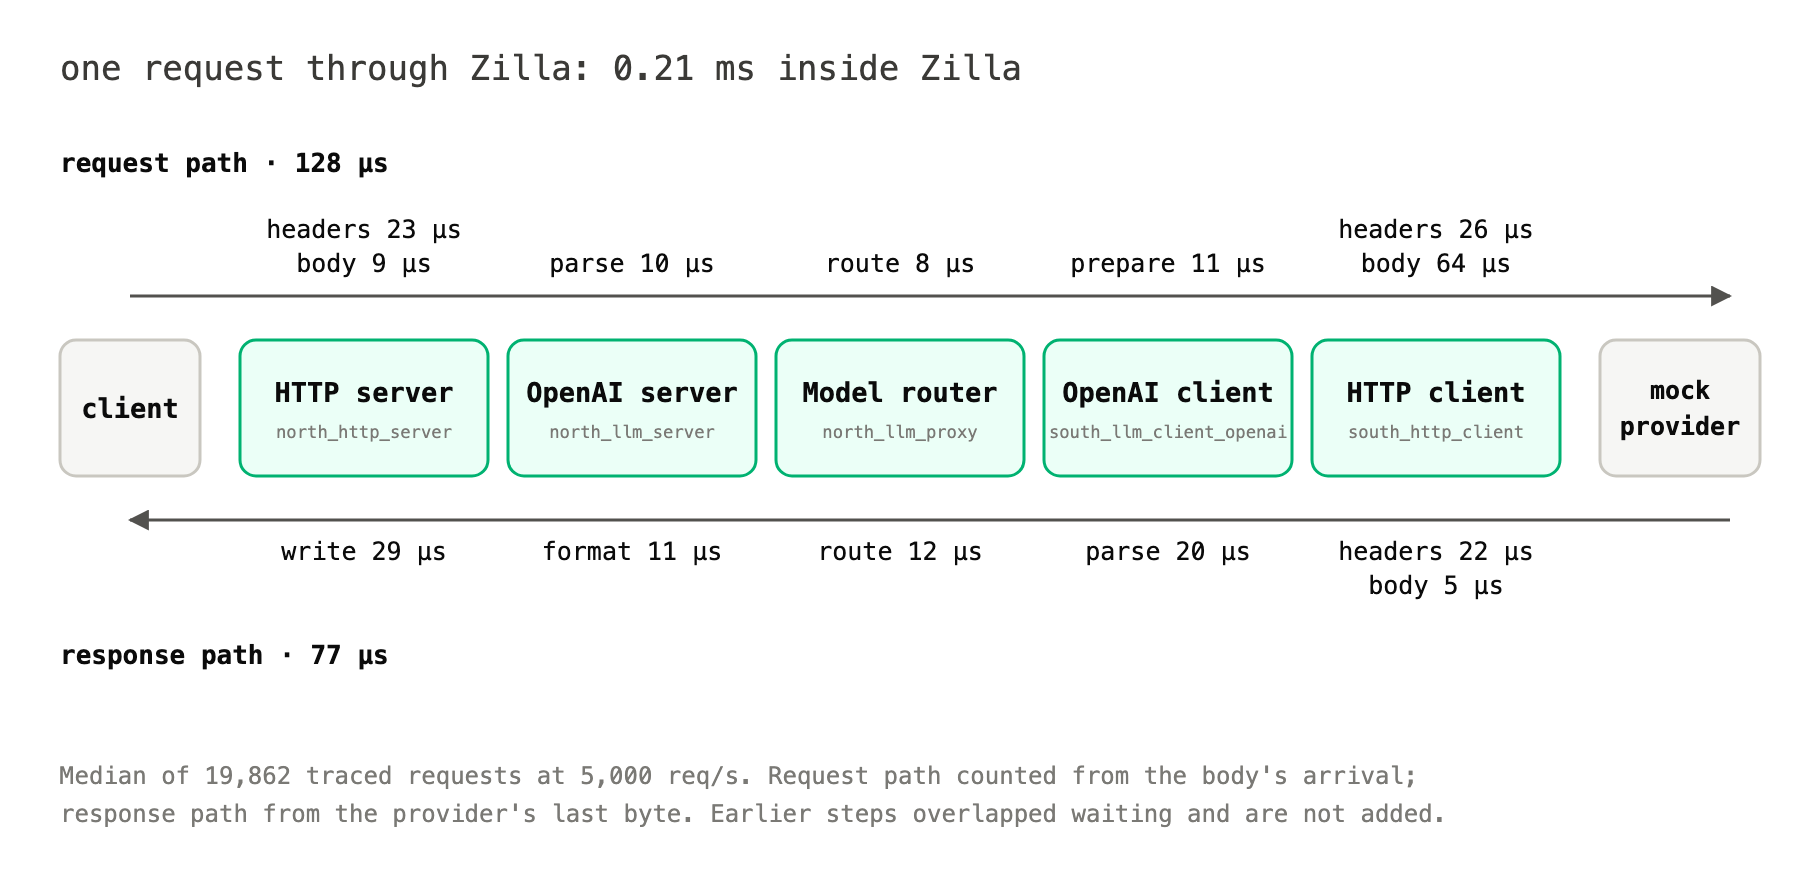
Of its 1,502 ms end to end, the mock provider and network took 1,501.0 ms. The request path is counted from the body's arrival, 110 µs after the headers, and the response path from the provider's last byte. Steps before those points ran while Zilla was waiting, so they are not added to the totals. All timings are for a 0.36 KB response; larger responses take longer to parse, re-encode, and send.
Request path
Response path
Comparison with Bifrost
The benchmarking repository used here is Bifrost's, and Bifrost publishes a t3.xlarge benchmark for the same 5,000 req/s scenario.
Bifrost's published result
The published page does not state the Bifrost version, the test duration, where the load generator and mock provider ran, or the concurrency setting. Its 1.50 s HTTP request time matches our mock provider's 1,500 ms latency.
Our Bifrost run
We ran Bifrost on the same three-host layout and workload as Zilla:
Results side by side, with each column's instance type and protocol. All three used 0.36 KB responses:
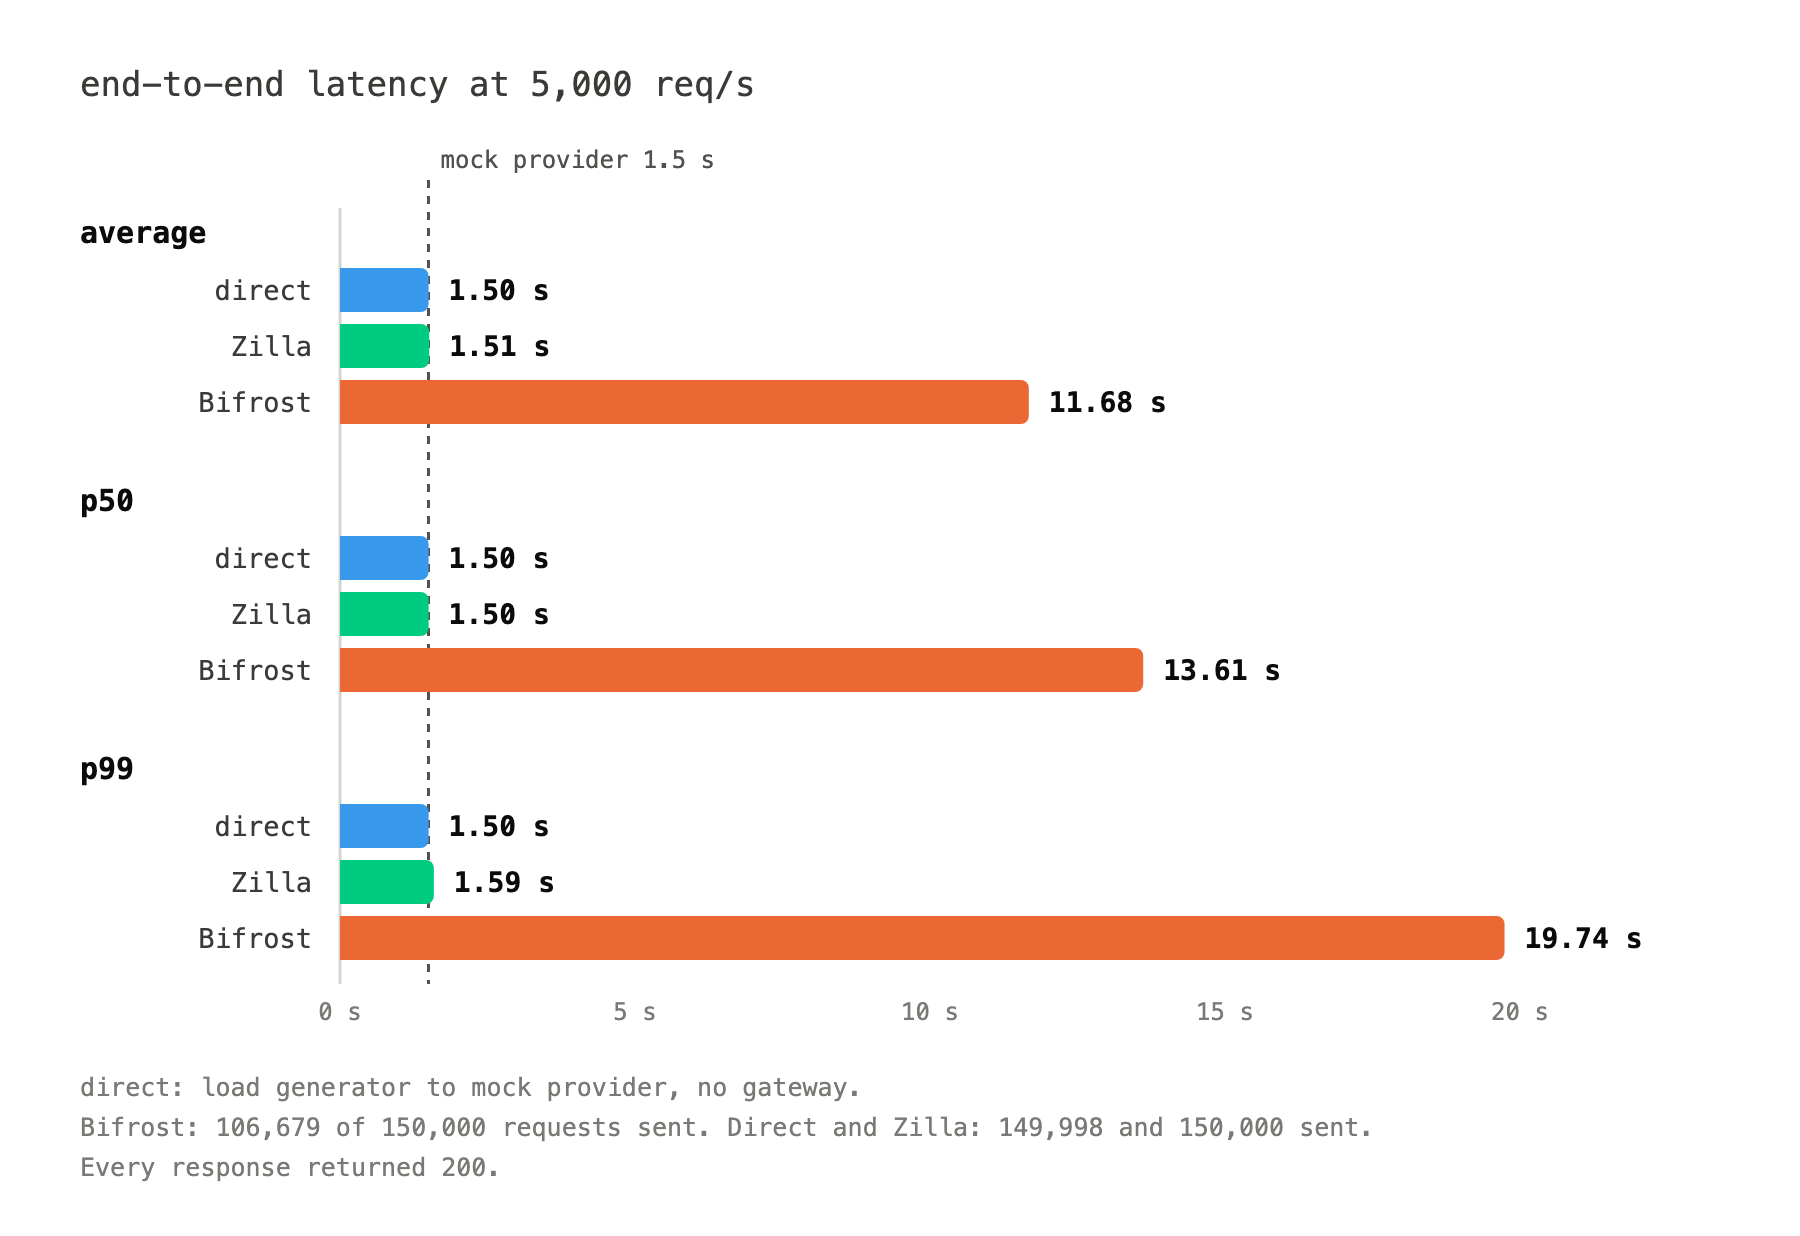
Unable to reproduce the published numbers
We ran Bifrost v2.3.2 with the published pool and buffer sizes and the repository's default 0.36 KB response, smaller than the published 10.32 KB.
Average latency was 11.7 s, against the published 1.61 s, and peak memory was 7.6 GB, against the published 3,340 MB. With each request taking that long, the load generator had to keep far more requests open at once, and it sent 106,679 of the 150,000 requests due in the measured window.
Differences between the two setups
- Instance type: Zilla ran on c7i.xlarge (4 vCPU, 8 GiB). Bifrost ran on t3.xlarge (4 vCPU, 16 GiB), the instance in its published benchmark. At this load Bifrost's memory grew past 7 GB, more than a c7i.xlarge provides. On a t3.xlarge at 5,000 req/s, Zilla's host was CPU-bound.
- Protocol: Zilla ran HTTP/2 cleartext on both sides. Bifrost ran HTTP/1.1 on both sides, as in its benchmarking repository.
- Load generator connections: with HTTP/2, the load generator multiplexes all requests over four connections. With HTTP/1.1, it needs one connection per in-flight request.
- Payload size: all runs in this post used about 0.5 KB requests and 0.36 KB responses, the benchmarking repository's defaults. Bifrost's published benchmark used 0.13 KB requests and 10.32 KB responses. The Bifrost benchmark repository's mock provider no longer has a setting for that response size, so we use the request and response sizes supported by the Bifrost benchmark.
Why the HTTP versions differ
We started on HTTP/1.1, the protocol the benchmarking repository's load generator and mock provider use, and then moved Zilla to HTTP/2 cleartext on both sides.
- Connections per request: at 5,000 req/s with a 1,500 ms provider, about 7,500 requests are in flight at any moment. HTTP/1.1 carries one request at a time on a connection, so the load generator and the gateway each need about 7,500 open connections, and more as latency rises. HTTP/2 carries the same requests as streams over a few connections.
- Bifrost on HTTP/2: Bifrost serves its OpenAI-compatible API and calls OpenAI-compatible providers through fasthttp, which supports HTTP/1.1 only. Its
enforce_http2network setting applies to the Bedrock provider, not to the OpenAI provider used here, so Bifrost's runs stayed on HTTP/1.1.
The Zilla and Bifrost results above are therefore not on the same HTTP version.
To compare on the same protocol, we also ran Zilla with HTTP/1.1 on both sides, with the same workload on c7i.xlarge. Bifrost ran on t3.xlarge, as above.
On HTTP/1.1, Zilla's p99 was about 9x lower than Bifrost's. Neither run was clean:
- Zilla answered 90% of requests. Of the rest, 13,074 were 502s from Zilla, 2,263 were connection resets, and 87 ended with EOF.
- Bifrost answered every request it received, but the load generator sent only 71% of the load because each request took so long.
On HTTP/2, Zilla answered all 150,000 requests at the same rate.
Cross Dialects
Zilla and Bifrost both accept OpenAI chat completions and Anthropic messages, and translate a request when the provider speaks the other dialect. The runs above send OpenAI requests to an OpenAI provider. To cover translation, we ran all four client and provider pairs with JSON responses:
- Client dialect: OpenAI chat completions or Anthropic messages.
- Provider dialect: OpenAI or Anthropic, chosen by the model (
gpt-4o-miniorclaude-haiku-4-5). When the two differ, the gateway translates the request and the response. - Rate: 2,000 req/s.
- Protocol: HTTP/1.1 on both sides for both gateways, Bifrost v2.3.2 and Zilla Plus 2.2.1-rc3.
- Hosts: each run on three newly launched c7i.xlarge instances, one run per cell.
All runs answered every request sent. CPU is the gateway process, out of 400% on the 4 vCPU host.
- Overhead: both gateways stayed within 100 ms of the mock provider at p99. Bifrost added 8 to 93 ms and Zilla 63 to 93 ms.
- Translation cost: Zilla's translated pairs ran within 30 ms of OpenAI to OpenAI. Bifrost's were 47 to 85 ms slower than its OpenAI to OpenAI.
- HTTP/2: with Zilla on HTTP/2 cleartext, JSON p99 was 1,536 to 1,552 ms, lower than over HTTP/1.1.
Streaming
Most LLM traffic is streamed. Chat interfaces and coding agents show text as it arrives, so the time to the first event is the delay a user feels, and every event a gateway holds back adds to it. A stream also keeps its request open for the whole response, so the gateway carries more work in flight than with a single JSON reply.
To measure streaming, we repeated the cross-dialect runs with streamed responses:
- Request:
stream: true, as OpenAI chat completions or Anthropic messages. - Client → provider: the same four pairs as the cross-dialect runs, with the provider chosen by the model (
gpt-4o-miniorclaude-haiku-4-5). - Response: the mock provider sends 10 text deltas spread over 1,500 ms, the first at once. The gateway relays them to the client as server-sent events in the client's dialect, translating them when the two dialects differ.
- Measured: the time to the first event, and the time to the end of the stream (
message_stopfor Anthropic,[DONE]for OpenAI). A stream that ends without its final event counts as an error. - Rate: 2,000 req/s, with a 10 s warm-up and a 30 s measured window (60,000 requests).
- Protocol: HTTP/1.1 on both sides for both gateways, Bifrost v2.3.2 and Zilla Plus 2.2.1-rc3.
- Hosts: the load generator, gateway, and mock provider each on a newly launched c7i.xlarge (4 vCPU, 8 GB), one run per cell.
Zilla's streams finished within 2.1 s at p99, and Bifrost's took up to 9.3 s.
All runs answered every request sent.
- Latency: Zilla held a p99 of 1.6 to 2.1 s. Bifrost's was 2.0 s from OpenAI to OpenAI and 3.9 to 9.3 s on every pair involving Anthropic. Bifrost converts every Anthropic request to its internal Responses format, even Anthropic to Anthropic; we did not measure how much of its slowdown that causes.
- First event: Zilla's first event arrived within 136 to 609 ms at p99, against Bifrost's 445 ms to 8.1 s.
- CPU: Zilla used 259 to 306%, Bifrost 318 to 350%.
- Translation cost: Zilla's translated streams were no slower than OpenAI to OpenAI.
- Higher rates: Bifrost's stream p99 reached 28.7 s at 3,000 req/s, and at 4,000 req/s it was OOM-killed.
- Variance: each cell ran once. Bifrost's streaming results varied between runs: the same Anthropic to OpenAI cell measured a p99 of 2.4 s in an earlier run on longer-lived hosts.
- HTTP/2: with Zilla on HTTP/2 cleartext, streaming measured a p99 of 2.2 to 4.4 s, higher than over HTTP/1.1. Every stream shares four client connections there; we have not investigated further.
Reproducing the Results
The load generator, mock provider, and gateway configurations are in the benchmarking repository, with the Zilla configuration and HTTP/2 client support in the Aklivity fork.
1. Start the mock provider on its own host:
2. Start Zilla on the gateway host, with zilla/zilla.yaml from the repository:
3. Run the load generator on its own host:
Closing Thoughts
At 5,000 req/s on a c7i.xlarge, Zilla answered all 150,000 requests and added 0.9 ms at p50 and 89 ms at p99 over a direct connection. Inside Zilla, the median request took 0.21 ms, and routing it by model took 20 µs.
Zilla records each step a request takes between its stages, so the time it adds can be broken down stage by stage rather than estimated from the outside.
Published gateway overhead figures each draw their boundary in a different place: which steps are counted, on which instance, and over which protocol, and with what payload size. When comparing two of them, the question to start with is what each number includes, and can it be reproduced from the published setup?
Resources

Ready to Get Started?
Get started on your own or request a demo with one of our data management experts.

Explore pricing
Straightforward, usage-based pricing with no per-connection surprises — start free and scale when you are ready.


Join the Community
Trade notes with the engineers running Zilla in production, and get help from the team in Slack or Discord.