Proxy Benefits With Near-Zero Latency Tax: Aklivity Zilla Benchmark Series (Part 1)
With Aklivity Zilla, we challenge the paradigm that proxies always add latency.


Introduction
Every time we have a design conversation with Kafka architects and system engineers, one question almost always comes up:
“So, how much latency does Zilla add to the existing flow?”
Our answer: Near zero. In fact, in some cases, Zilla can cut tail latency by 2-3x.
It’s a fair question. For years, teams have had to accept a fundamental tradeoff: adding latency just to make their data platforms accessible to more data products.
In Part 1 of our benchmark series, we enable you to run benchmarks against Aklivity Zilla Plus instances deployed on AWS EC2 instances to test our claims. This benchmark is based on the Linux Foundation’s OpenMessaging Benchmark.
Why we ran the benchmark
With Aklivity Zilla, we challenge the paradigm that proxies always add latency. As a multi-protocol, stateless edge and service proxy, Zilla Plus is built to deliver enterprise-grade capabilities with Near-Zero latency tax. But we’re not just minimizing overhead. We’re accelerating performance.
More importantly, Zilla's efficiency isn't limited to Kafka. Its protocol-agnostic support& stream-based stateless architecture ensures high performance across protocols, whether you're using Kafka, MQTT, gRPC, HTTP, or SSE.
How we ran the benchmark
We used the OpenMessaging Benchmark (OMB), a standard performance benchmarking framework for distributed messaging systems supported by the Linux Foundation.
OMB provided a de facto standard way to make apples-to-apples comparisons, allowing us to evaluate relative performance for different workloads and conditions.
Benchmark Setup
OpenMessaging Benchmark
We created a fork of the OpenMessaging Benchmark (OMB) repo, which allowed us to integrate Zilla Plus into the benchmarking flow and maintain consistency with the existing Kafka workloads.
Setup
Introducing Zilla Plus in this data path brings capabilities that go well beyond performance improvements.
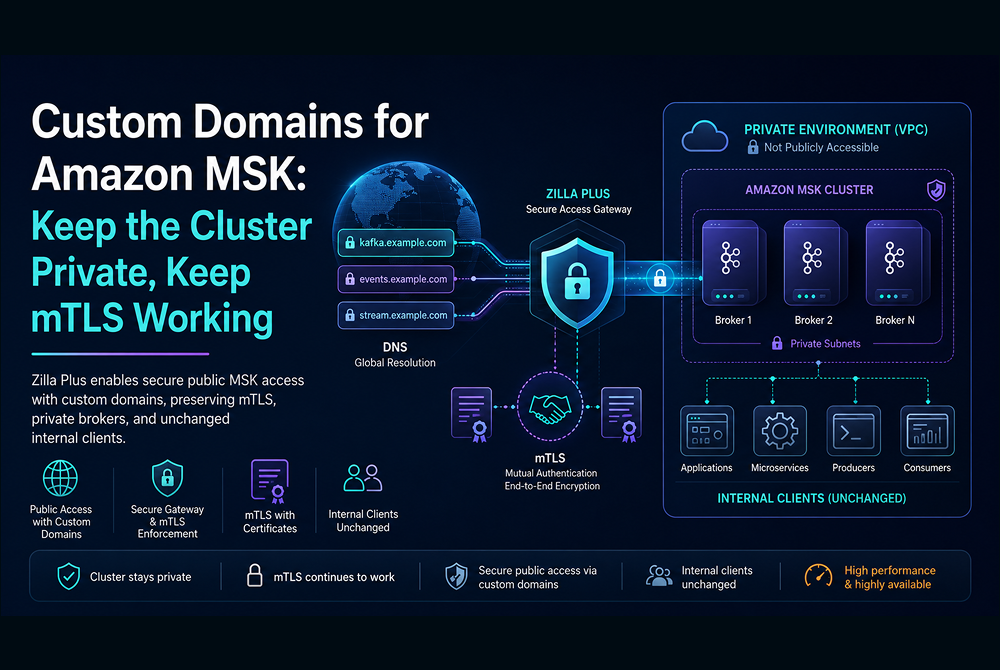
- Secure Public Access: Zilla Plus provides a secure, externally reachable entry point to an internally deployed Kafka cluster.
- Multi-Tenant Virtual Clusters: Logically segment a single Kafka cluster to enable multiple independent client groups to operate in isolation.
- …and much more.
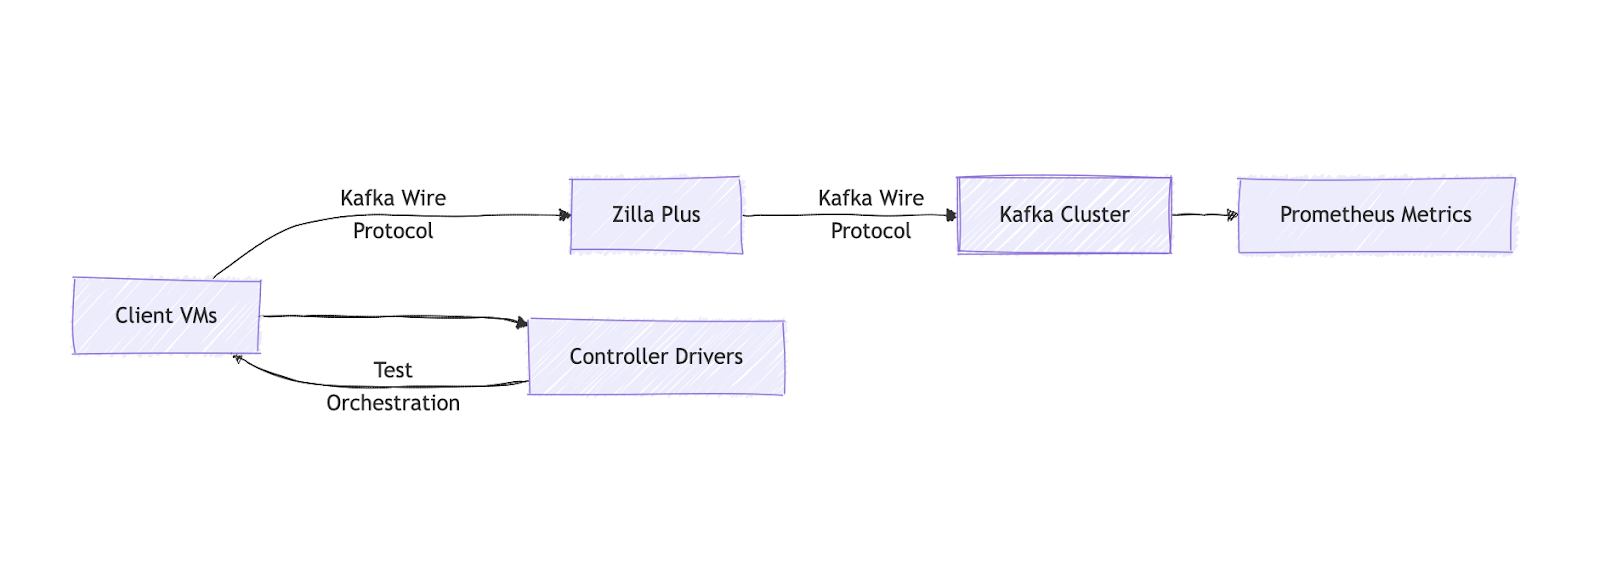
All services were deployed on AWS EC2 instances. Here's the breakdown of the cluster setup:
All workloads were run on Apache Kafka 3.6.0 with KRaft. The Apache Kafka server-side configs for the number of replica fetchers, network threads, and I/O threads were set to num.replica.fetchers=16, num.network.threads=16, num.io.threads=16.
Our benchmarks used the following client configurations and other specifications:
Test: Apache Kafka vs. Apache Kafka proxied through Zilla Plus
We conducted our benchmarking across two deployment configurations:
- Apache Kafka (Baseline): Standard Kafka deployment
- Zilla Plus + Apache Kafka: The same Kafka setup proxied by Zilla Plus.
We ran tests across two capacity tiers to reflect different streaming workloads:
- Small Tier (6 Brokers)
- Large Tier (21 Brokers)
Our goal throughout this exercise was to evaluate not just raw latency improvements, but also the predictability and consistency of latency that remained under sustained load over the benchmark duration (30 minutes warmup + 1 hour test).
Tier Infrastructure
For this benchmark, we use GP3, a type of general-purpose solid-state drive (SSD) storage provided by Amazon Elastic Block Store (EBS).
Small Tier
Large Tier
Importance of Low Latency in the Real World
Latency isn't just a technical metric; it directly impacts user experience, business outcomes, and operational efficiency.
In industries such as Finance, Retail, and Manufacturing, every millisecond of added delay can impact real-time use cases, degrade customer experience, and ultimately lead to revenue loss.
In this OpenMessaging Benchmark, we compare Publish Latency and End-to-End Latency between two setups: a standard Apache Kafka deployment and Zilla Plus in front of Apache Kafka.
This helps us understand the performance impact of introducing Zilla Plus into the data path.
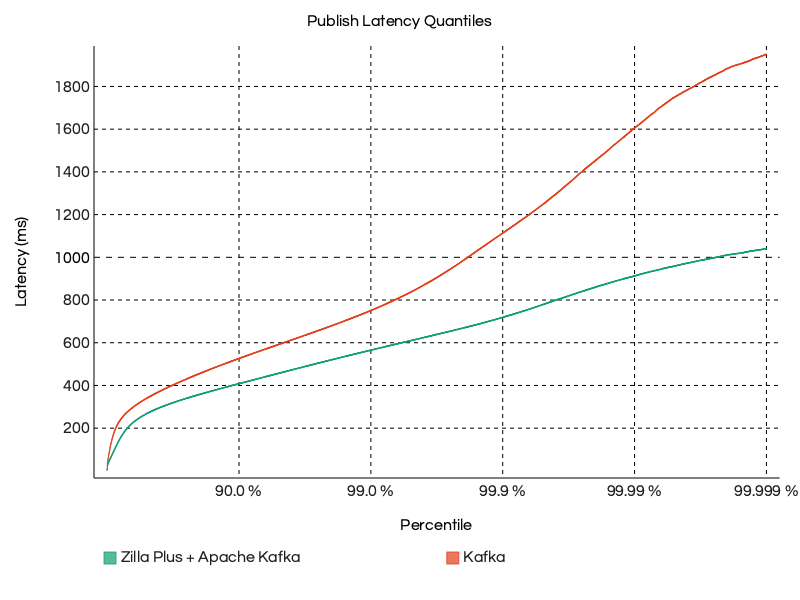
Publish Latency
Publish latency is the time it takes for a message to travel from the producer to the Kafka broker. Specifically, the elapsed time from the message being sent until the broker confirms that the message has been successfully written to its log and replicated to all of its in-sync replicas (ISRs).
In the Small Tier test scenario running at 100MB/s throughput, Zilla Plus consistently delivered lower and more stable publish latency across all quantiles.
Compared to the baseline Kafka setup, Zilla reduced latency spikes and maintained a flatter distribution, especially at higher percentiles, demonstrating ~2x better performance under sustained and peak load conditions.
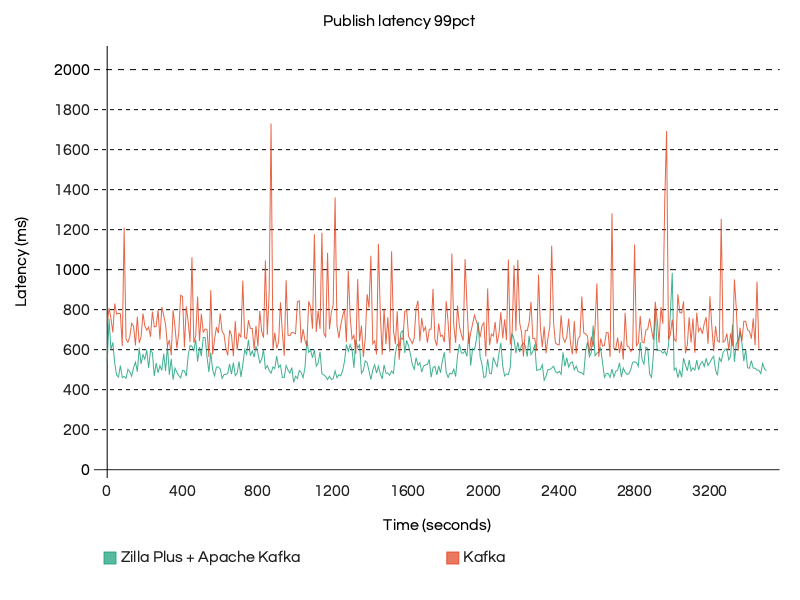
Why do p99 publish latencies matter?
While average latency gives a broad picture, the 99th percentile (p99) represents the latency below which 99% of messages are processed.
In real-time systems, especially for high-throughput environments, this tail latency can directly impact SLAs and user-facing performance.
The graphs below illustrate the consistency of Zilla Plus performance over an extended period, spanning a 30-minute warmup followed by 1 hour of benchmark workload. Despite the continuous load, Zilla Plus maintains a steady 99th percentile latency without significant spikes or variance.
End-to-End Latency
End-to-end latency is the total time it takes for a message to be produced by a producer, pass through the broker, and be consumed by a consumer. It captures the full journey of the message across the streaming pipeline.
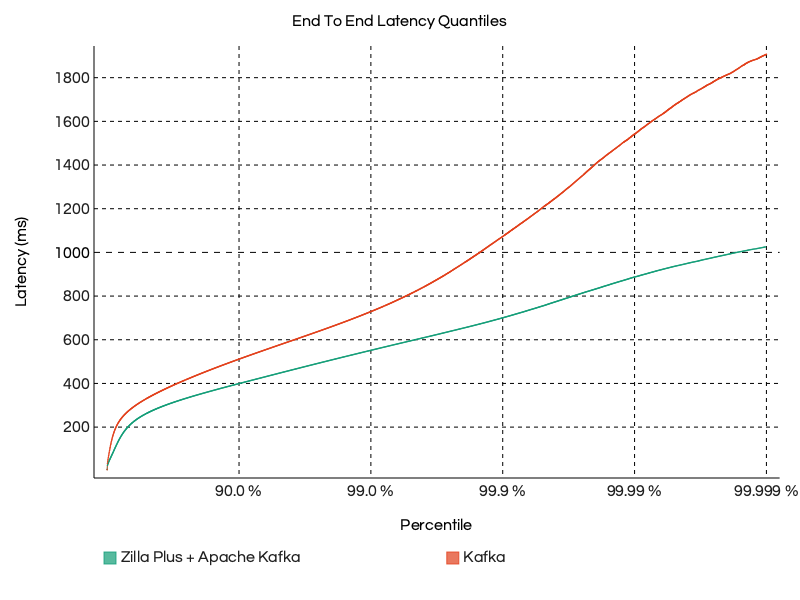
In the Small Tier test scenario running at 100MB/s throughput, Zilla Plus consistently delivered lower and more stable end-to-end latency across all measured quantiles.
Compared to the baseline Kafka setup, Zilla significantly flattened tail latencies, especially at the 99th and 99.9th percentiles. This translates to ~25% to 35% improvement in end-to-end delivery under load, highlighting Zilla’s efficiency in minimizing latency accumulation across the entire data path.
Why do p99 end-to-end latencies matter?
Just like publish latency, end-to-end latency at the 99th percentile is a key metric.
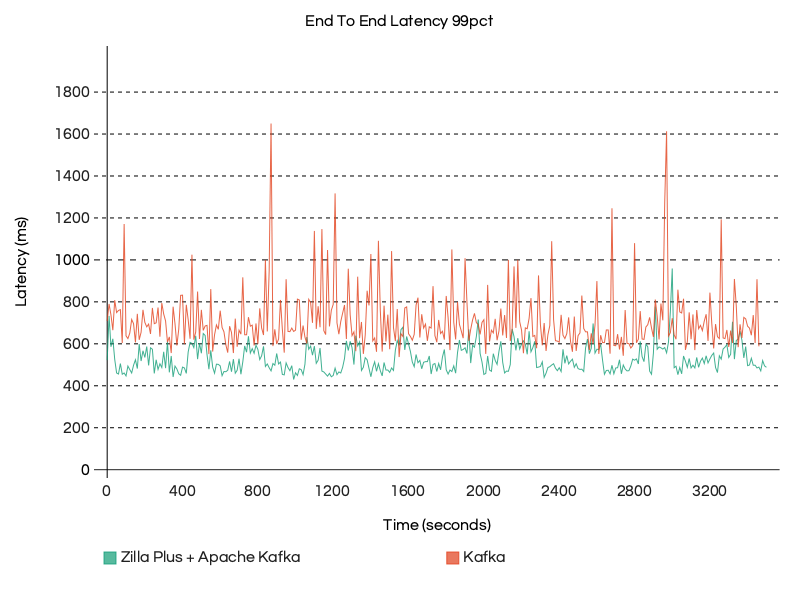
In the graph below, you can observe that Zilla Plus is maintaining a consistent p99 end-to-end latency profile throughout a 90-minute run (30-minute warmup plus 1-hour test) at 100MB/s throughput on a Small Tier setup.
By contrast, Apache Kafka alone exhibits significant variability, with frequent and sharp latency spikes, some reaching nearly 1000-1200 ms, whereas Zilla Plus consistently maintains a latency of around 600 ms, reducing it by 2x.
This stability highlights how Zilla Plus effectively absorbs and smooths out latency variation in the system, ensuring low and predictable latency at the 99th percentile, even under long-running, high-throughput workloads.
Things worth highlighting
- We ran the benchmark using 3 m5.xlarge Zilla Plus instances vs 6 m5.xlarge for both Kafka & Client instances.
- As a proxy that handles both client-side and broker-side network traffic, Zilla effectively doubles the throughput of the client or broker alone. While the Kafka workload was set at 100 MB/s, Zilla was pushing 200 MB/s.
- Zilla CPU is balanced across the 4 CPUs at approximately 65%.
What makes Zilla so special?
Aklivity Zilla is built to streamline, secure, and manage event-driven architectures (EDAs) with scalability and performance at its core.
Unlike traditional Java-based gateways that rely on frameworks like Netty, suffer from GC pauses or deep method call stacks, Zilla minimizes object allocation overhead on the data path by using code-generated flyweight objects over binary data.
Zilla uses this optimized approach to create mappings for HTTP, Server-Sent Events, gRPC and MQTT entry points to and from Kafka, letting the client remain unaware that Kafka is present in the application architecture behind Zilla.
Zilla Architecture
On startup, Zilla parses its declarative configuration and spawns one engine worker per CPU core. Each worker runs independently in a single-threaded context, ensuring no locking or thread contention.
Zilla protocol pipelines are defined by a declarative, routed graph of bindings. No matter the protocol, streams of data flow between Zilla bindings over shared memory.
For a deeper understanding of how Zilla works, check this blog post.
Scalability
Zilla is designed to scale efficiently both Vertically & Horizontally. All modular components are instantiated within each worker, enabling consistent behavior across threads.
As a result, Zilla naturally scales with the number of CPU cores, maximizing parallelism and throughput.
Whether scaling up vertically (by adding more CPU cores) or horizontally (by adding more instances), Zilla continues to perform predictably.
Zilla’s telemetry feature provides detailed runtime metrics, making it easier to integrate with auto-scaling policies based on CPU usage or traffic volume.
As load increases, additional resources can be provisioned automatically, and Zilla being stateless, it can take advantage of new capacity without requiring bootstrapping or rebalancing.
Conclusion
In summary, Zilla Plus delivers consistent, low-latency performance across demanding streaming workloads. With Zilla Plus, you can extend your Kafka deployments with zero latency tax and in many cases, even improve performance.
Across both publish and end-to-end latency metrics, Zilla Plus consistently delivered faster, flatter tail latency profiles at the 99th percentile and beyond. This improvement held steady throughout sustained workloads over 90 minutes, even while handling double the traffic per instance. Compared to Apache Kafka alone, Zilla Plus reduced the 99th percentile latency by up to 2x.
This is just Part 1 of our ongoing benchmark series. Stay tuned as we explore additional deployment patterns, higher throughput tiers, and multi-protocol-specific performance benchmarks in future posts.
What’s Next?
Explore the Zilla documentation for detailed configuration and deployment instructions.
Zilla Examples: Hands-on guides and configurations for real-world use cases.
Zilla Demos: End-to-end demonstrations of Zilla powering real-time systems.
Join the Zilla Community! Share your experiences and questions on Slack.


Ready to Get Started?
Get started on your own or request a demo with one of our data management experts.